To find out your body fat percentage, use an online calculator. The proposed meter allows you to calculate the calculation of body mass index, waist-to-height ratio, percentage of fat, weight, daily amount of calories and protein required by the body.
Calculating your fat percentage helps you track and control the level of effectiveness of your chosen weight loss strategy.
How and what to measure?
You need to measure your height, weight, waist, neck and hip circumference. Also indicate your daily activity level. Enter the obtained measurements into the calculator, click the “Calculate” button.
| What's your gender | What's your gender |
| Your height (in centimeters): | |
| Your weight (in kilograms): | |
| Your waist (in centimeters): | |
| Your neck (in centimeters): | |
| Your hips (in centimeters): | |
| Physical activity: | Physical activity: |
Body parameters
To take measurements you will need a measuring tape and scales. Take measurements with an accuracy of 0.5 cm. Make sure that the measuring tape does not tighten the skin, but does not hang loosely.
- Height – measure your height without shoes;
- Weight – get on the scale in the morning, without clothes, first visit the toilet and not have breakfast;
- Waist - for men, measure the waist in the navel area, for women - in the narrowest part of the abdominal cavity;
- Neck – measure the circumference of the neck under the Adam’s apple;
- Hips – measure at the widest part of the hips.
Activity level
- Minimal – passive lifestyle, computer work, rare irregular exercise;
- Moderate – daily walking, work in motion, active recreation;
- Active – regular exercise, heavy physical work.
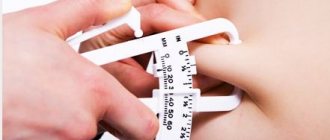
What is a caliper?
Designed by commons.wikimedia.org
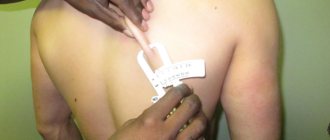
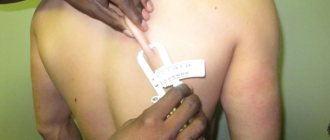
A folding caliper is a simple device similar to a compass. The principle of operation is to measure the thickness of skin folds at key points in the body. For measurements, areas are usually taken on the lower back, biceps, thighs and other places. The device is simple in design, inexpensive and sold in any pharmacy. If you are concerned about your health, we strongly recommend getting one.
The tables (shown below) show the location of measurement areas, as well as the norm of fat for people of different ages. It is important that measurements are taken as close as possible to the area indicated in the table and illustrations.
Decoding the results
Body mass index is the ratio of a person’s weight and height. The formula BMI = kg/m2 allows you to determine how much your weight corresponds to the norm. The formula does not take into account your body type, so it will give inaccurate results if you are an athlete with developed muscles.
| Mass deficit | BMI < 18.5 |
| Norm | BMI 18.5 – 24.9 |
| Overweight | BMI 25-29.9 |
| Obesity | BMI ≥ 30 |
Waist-to -height ratio measures how much abdominal fat a person has in the body. Underdeveloped abdominal muscles and large amounts of abdominal fat lead to diseases of the cardiovascular system, liver and gastrointestinal tract.
Body fat percentage – the acceptable amount of fat is different for men and women. The accumulation of fat on the abdomen and thighs in women is explained by the need to have an additional source of nutrition and energy in case of pregnancy. A man's body needs more muscle to protect and provide for his family.
| Body fat level | women | men |
| Minimum | 10-12% | 2-4% |
| Athletes | 14-20% | 6-13% |
| Average | 21-24% | 14-17% |
| Acceptable | 25-31% | 18-25% |
| Fat | ≥ 32% | ≥ 26% |
Lean body weight – calculated using the formula: Weight x (100 – fat percentage). The calculation allows you to find out a person’s weight without fat deposits.
Minimum calorie requirements - the result shows how many calories the body of a person of a certain height and weight needs for normal functioning. The calculation is entirely dependent on the BMI value, if the body mass index is greater than 25 (which means overweight or obese), the calculator reduces the daily calorie intake by 15%.
The amount of protein per day - the result is influenced by the body mass index, height, and activity level of the person. The protein norm is calculated based on:
- 0.8 grams per 1 kg of weight for people who lead a sedentary lifestyle;
- 1.1 grams for moderately active;
- 1.4 grams for energetic, active people.
Based on the daily protein requirement, the amount of other components of the diet is adjusted. Be sure to include the right amount of protein in your diet to ensure normal muscle growth with a reduced calorie intake. Protein diets use the following proportion: 30% protein, 30% fat, 40% carbohydrates.
Protein diet
| Squirrels | Fats | Carbohydrates | |
| Calories | 30% | 30% | 40% |
| 2000 | 600 cal | 600 cal | 800 cal |
| 150 g | 67 g | 200 g |
Low carb diet
| Squirrels | Fats | Carbohydrates | |
| Calories | 25% | 65% | 10% |
| 2000 | 500 cal | 1300 cal | 200 cal |
| 125 g | 144 g | 50 g | |
| 1800 | 450 cal | 1170 cal | 180 cal |
| 113 g | 130 g | 45 g |
How to Determine Muscle Loss or Gain
Measuring muscle loss or gain is one of the most important areas where body fat data can be used. Knowing your fat percentage and weight, you can easily determine your “lean body mass.” Since muscle tissue is a component of muscle mass, changes in “lean mass” are caused by changes in muscle mass.
In order to determine lean mass, it is necessary to measure body fat and body weight as accurately as possible. After dieting or training, measurements must be repeated. Any change in muscle mass reflects how much muscle you have lost or gained.
Example for men: For example, a man weighing 95 kilograms, body fat percentage 30%. We multiply 95 kg by 30%, we get 28.5 kg - the weight of fat contained in the body. Subtract 28.5 from 95 and get 66.5 - lean mass. After a month of regular training and proper nutrition, his weight dropped to 88 kilograms, and his fat percentage dropped to 25% (22 kg). Thus, now his lean mass is 66, that is, in a month he lost 500 grams of muscle and 6.5 kilograms of fat. An excellent result, indicating that he chose the right training and nutrition program.
In the form of formulas, all calculations will look like this:
Before: Fat mass = 30% and Body weight = 95 kg. 95 x 0.30 = 28.5 kg. 95 – 28.5 = 66.5 kg. lean mass
After: Fat Mass = 25% and Body Weight = 88 lbs 88 x 0.25 = 22 kg. 88 – 22 = 66 kg. lean mass
Difference: 66.5 – 66 = 0.5 kg. loss of muscle mass 28.5 – 22 = 6.5 kg. fat loss
Example for women:
Woman weighing 68 kilograms, body fat percentage 30%. Fat mass will be 20.4 kg. We subtract the resulting number from her 68 kilogram weight and get 47.6 kg of lean mass. After a month of a low-calorie diet, she lost 10 kilograms and now weighs 58 and has a body fat percentage of 27% (15.6 kg). Lean weight – 42.4 kg. Thus, the loss of muscle mass was 5.2 kg, and fat loss - 4.8 kg. It follows that she lost almost equal amounts of muscle tissue and fat, which indicates an incorrectly chosen weight loss program.
In the form of formulas, all calculations will look like this:
Before: Fat mass = 30% and Body weight = 68 kg. 68 x 0.30 = 20.4 kg. 68 – 20.4 = 47.6 kg. lean mass
After: Fat mass = 27% and Body weight = 58 kg. 58 x 0.27 = 15.6 kg. 58 – 15.6 = 42.4 kg. lean mass
Difference: 47.6 – 42.4 = 5.2 kg. loss of muscle mass 20.4 – 15.6 = 4.8 kg. fat loss
People who have lost a lot of muscle and gained a lot of fat due to inactivity can actually gain back lost muscle and burn fat at the same time. For example, a 68-year-old man weighs 70 kg. The sum of the measurements taken with the caliper indicates 28% fat. That's 19.6 kilograms of fat and 50.4 kilograms of lean mass. After 4 months of active strength training and the right month, his weight dropped to 68 kg and his body fat percentage dropped to 18%. Thus, fat mass was 12.2 kg and lean mass was 55.8 kg. That is, in 4 months he lost 7.4 kg of fat and gained 5.4 kg of muscle.
Schematically:
Before: Fat mass = 28% and Body weight = 70 kg. 70 x 0.28 = 19.6 kg. 70 – 19.6 = 50.4 kg. lean mass
After: Fat mass = 18% and Body weight = 68 kg. 68 x .18 = 12.2 kg. 68 – 12.2 = 55.8 kg. lean mass
Difference: 55.8 – 50.4 = 5.4 kg. muscle mass gain 19.6 – 12.2 = 7.4 kg. fat loss
Acceptable percentage of fat
How much fat mass can be contained in the human body? Professional bodybuilders, preparing for competitions, reduce the amount of fat mass to 3-4%. Their bodies are a perfect relief of muscles that appear at the slightest tension.
A low mass index and insufficient amount of adipose tissue lead to metabolic disorders in the body. The condition of the skin and hair worsens. Sex hormones are not produced, reproductive function is disrupted.
- The minimum index is 5% for men and 10% for women.
- The normal amount of adipose tissue is 12-20% in men and 18-25% in women. This index corresponds to an athletic, moderately sculpted physique and good health.
- Clear signs of overweight and obesity : underdeveloped muscles, body mass index greater than 30, fat percentage greater than 30% in men and 35% in women.
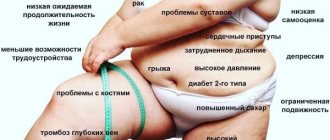
With obesity, the person’s appearance primarily suffers - fat folds on the abdomen, chest, increased sweating, and an unaesthetic appearance.
In addition, there is a risk of cardiovascular diseases, joints are destroyed, and the spine is bent under the weight of extra pounds. The psyche suffers - self-esteem decreases, self-dislike, irritability, and depression appear.
Comparison table of methods
You can calculate fat mass in the human body using one or another of the methods presented above. The arithmetic mean coincides with the calculation results.
comparison table
| US Navy method | 16,8% |
| Covert Bailey method | 17,0% |
| BMI method | 17,8% |
| YMCA method | 17,54% |
| Additional YMCA method | 18,1% |
| Average | 17,45% |
To find out your fat percentage, you don’t have to go to specialized clinics or medical centers. There are a huge variety of different methods, each of which can be used at home. All of the above methods guarantee accurate results if the instructions for implementation are followed.
How else can you calculate your fat percentage?
There are other ways to calculate your body fat percentage. In laboratory conditions, a special device is used to measure excess weight and obesity.
Bioimpedance
You can find out how much fat your body contains using the bioimpedance method (measuring electrical resistance) . Doctors studied the difference in electrical resistance of fat, muscles, bones, water and, based on the knowledge gained, created a device to determine the percentage of fat. The accuracy of the method is an error of no more than 2%.
Now you can buy a household analogue - scales for measuring the percentage of fat and muscle, the work of which is based on the bioimpedance method.
The scale sends a weak electrical impulse through the body. The current strength, taking into account the potential difference, shows the degree of electrical resistance of tissues in the body. Depending on the degree of resistance, the composition of the fabric is determined.
Scales based on the bioimpedance method have a number of disadvantages:
- The scales should only be used in a warm room at normal body temperature. Expansion or contraction of blood vessels due to exposure to external temperatures is unacceptable.
- Weight measurement is carried out on an empty stomach. You cannot take diuretics - the result is greatly distorted.
- You should not get heavy exercise or take a shower before measuring your weight in order to exclude external influence on the water-salt balance in the body.
- The electrical impulse travels along the shortest path, so the device takes into account only the resistance of the leg tissue. If you have thin legs but a big belly, the scale will not show an accurate result.
Weighing in water
To study the stage and degree of obesity, doctors use water weighing. The method is based on theoretical knowledge about the density of fat, which differs from muscle tissue.
A person is weighed in air and in water, then, using complex formulas, the difference between the indicators is calculated and the percentage of fat is calculated.
The procedure is as follows: a person sits in a special chair for measuring mass, connected to a scale. You need to exhale deeply, after which the chair is immersed in water for 10 seconds. To obtain accurate measurements, the procedure is carried out three times.
Fat fold measurement
Measuring the percentage of fat based on the thickness of the fat folds is a simpler and safer method of studying the degree of obesity. Doctors have a special meter for these purposes - a caliper, but you can use a caliper and even a regular ruler.
The essence of the method is to pinch the fat fold at four points on the body and measure its thickness:
- Pinch the fat fold on the triceps, midway between the shoulder and elbow joints, and measure the thickness;
- Similarly, measure the fat fold on your biceps.
- Measure the fold under the shoulder blade and pinch the skin at an angle of 45° to the vertical. Make sure that the fold is located along the line that connects the cervical spine and sides.
- Take a measurement of the fat fold in the navel area, choosing the area with the largest amount of fat.
The results obtained are summarized. To calculate your fat percentage, use a special table.
For men
For women
The estimated error of the method is no more than 2-3% if the measurements are made correctly. The table takes into account the gender and age of a person, since over time the fat layer inevitably increases - fat accumulates under the skin, in muscles, on internal organs.
THESE ARTICLES WILL HELP YOU LOSE WEIGHT
How to measure?
Stand up straight, straighten your back. Grab the fold of skin and fat just below the navel horizontally - thumb on top, index finger on bottom. Place the ruler horizontally, resting its end on the stomach, and measure the thickness of the fold in millimeters. Then find the resulting value in the table below based on your age. The content of adipose tissue in the body of women (in percent)
| Subcutaneous fat fold, mm | 18-29 years old | 30-39 years old | 40-49 years old | 50 or more years |
| 15 | 10,5 | — | — | — |
| 20 | 14,1 | 17 | 19,8 | 21,4 |
| 25 | 16,8 | 19,4 | 22,2 | 24 |
| 30 | 19,5 | 21,8 | 24,5 | 26,6 |
| 35 | 21,5 | 23,7 | 26,4 | 28,5 |
| 40 | 23,4 | 25,5 | 26,2 | 30,3 |
| 45 | 25 | 26,9 | 29,6 | 31,9 |
| 50 | 26,5 | 28,2 | 31 | 33,4 |
| 55 | 27,8 | 29,4 | 32,1 | 34,6 |
| 60 | 29,1 | 30,6 | 33,2 | 35,7 |
| 65 | 30,2 | 31,6 | 34,1 | 36,7 |
| 70 | 31,2 | 32,5 | 35 | 37,7 |
| 75 | 32,2 | 33,4 | 35,9 | 38,7 |
| 80 | 33,1 | 34,3 | 36,7 | 39,6 |
| 85 | 34 | 35,1 | 37,5 | 40,4 |
| 90 | 34,6 | 35,8 | 38,1 | 41,2 |
| 95 | 35,6 | 36,5 | 39 | 41,9 |
| 100 | 36,4 | 37,2 | 39,7 | 42,6 |
| 105 | 37,1 | 37,9 | 40,4 | 43,3 |
| 110 | 37,8 | 38,6 | 41 | 43,9 |
| 115 | 38,4 | 39,1 | 41,5 | 44,5 |
| 120 | 39 | 39,6 | 42 | 45,1 |
| 125 | 39,6 | 40,1 | 42,5 | 45,7 |
| 130 | 40,2 | 40,6 | 43 | 46,2 |
| 135 | 40,8 | 41,1 | 43,5 | 46,7 |
| 140 | 41,3 | 41,6 | 44 | 47,2 |
| 145 | 41,8 | 42,1 | 44,5 | 47,7 |
| 150 | 42,3 | 42,6 | 45 | 48,2 |
| 155 | 42,8 | 43,1 | 45,4 | 48,7 |
| 160 | 43,3 | 43,6 | 45,8 | 49,2 |
| 165 | 43,7 | 44 | 46,2 | 49,6 |
| 170 | 44,1 | 44,4 | 46,6 | 50 |
| 175 | 44,4 | 44,8 | 47 | 50,4 |
| 180 | 44,7 | 45,2 | 47,4 | 50,8 |
| 185 | 45 | 45,6 | 47,8 | 51,2 |
| 190 | 45,3 | 45,9 | 48,2 | 51,6 |
| 195 | 45,5 | 46,2 | 48,5 | 52 |
| 200 | 45,5 | 46,5 | 48,8 | 52,4 |
| 205 | 45,8 | 46,8 | 49,1 | 52,7 |
| 210 | 46 | 47,1 | 49,4 | 53 |
Content of adipose tissue in the body of men (in percent)
| Subcutaneous fat fold, mm | 18-29 years old | 30-39 years old | 40-49 years old | 50 or more years |
| 15 | 4,8 | — | — | — |
| 20 | 8,1 | 12,2 | 12,2 | 12,6 |
| 25 | 10,5 | 14,2 | 15 | 15,6 |
| 30 | 12,9 | 16,2 | 17,7 | 18,6 |
| 35 | 14,7 | 17,7 | 19,6 | 20,8 |
| 40 | 16,4 | 19,2 | 21,4 | 22,9 |
| 45 | 17,7 | 20,4 | 23 | 24,7 |
| 50 | 19 | 21,5 | 24,6 | 26,5 |
| 55 | 20,1 | 22,5 | 25,9 | 27,9 |
| 60 | 21,2 | 23,5 | 27,1 | 29,2 |
| 65 | 22,2 | 24,3 | 28,2 | 30,4 |
| 70 | 23,1 | 25,1 | 29,3 | 31,6 |
| 75 | 24 | 25,9 | 30,3 | 32,7 |
| 80 | 24,8 | 26,6 | 31,2 | 33,8 |
| 85 | 25,5 | 27,2 | 32,1 | 34,8 |
| 90 | 26,2 | 27,8 | 33 | 35,8 |
| 95 | 26,9 | 28,4 | 33,7 | 36,6 |
| 100 | 27,6 | 29 | 34,4 | 37,4 |
| 105 | 28,2 | 29,6 | 35,1 | 38,2 |
| 110 | 28,8 | 30,1 | 35,8 | 39 |
| 115 | 29,4 | 30,6 | 36,4 | 39,7 |
| 120 | 30 | 31,1 | 37 | 40,4 |
| 125 | 30,5 | 31,5 | 37,6 | 41,1 |
| 130 | 31 | 31,9 | 38,2 | 41,8 |
| 135 | 31,5 | 32,3 | 38,7 | 42,4 |
| 140 | 32 | 32,7 | 39,2 | 43 |
| 145 | 32,5 | 33,1 | 39,7 | 43,6 |
| 150 | 32,9 | 33,5 | 40,2 | 44,1 |
| 155 | 33,3 | 33,9 | 40,7 | 44,6 |
| 160 | 33,7 | 34,3 | 41,2 | 45,1 |
| 165 | 33,7 | 34,6 | 41,6 | 45,6 |
| 170 | 34,5 | 34,8 | 42 | 46,1 |
| 175 | 34,9 | 35 | 42,4 | 46,5 |
| 180 | 35 | 35,2 | 42,8 | 46,9 |
| 185 | 35,6 | 35,4 | 43 | 47,3 |
| 190 | 35,9 | 35,6 | 43,3 | 47,7 |
How to measure fat levels: bioimpedance vs eyeball vs DEXA (Densitometry)
Since the first review of the MGB scales, the controversy has not subsided, and for good reason. However, we will once again list the most common ways to assess body composition, talk about coincidences and share a life hack on where to get the cheapest densitometry in Moscow.
So, there are quite a few ways to analyze the body for components such as fat/bone mass, etc. Here in the comments they even added “by eye” and “mirror”. And these people turned out to be right too!
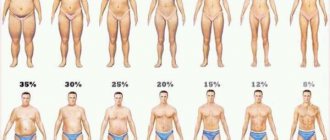
A truly adequate person with normal self-esteem can simply compare himself with the pictures:
And these pictures will quite transparently hint to him that it is time to change something or not. The second method at hand is the method with a caliper. This is a thing for 100 rubles from Aliexpress, with which you can make a mistake twice as much, but again: if you are really fat, it will show it.
You measure subcutaneous fat by clamping this “clothespin” so that the arrows on the handle are opposite each other. On the human test sample the figure is 8-10, and according to the table this is about 12% fat. The difference with the readings is explained by the fact that this thing (so they say) only measures subcutaneous fat, and not fat in the entire body, which is in both bones and muscles. But you can understand whether you are fat or thin.
Among the analyzes of average availability is bioimpedansometry, which is not popular here. The method, let's be honest, still invites comparison and contrast. Various scientific materials write that compared to the reference bioimpedance gives a difference of 3 to 6%, but at the same time it is characterized by the reproducibility of the results. Some write almost categorically that bioimpedance technology can provide accurate readings of fat mass.
At the same time, it is important to note here that we are talking about so-called clinical bioimpedance meters, primarily Tanita models, common in the West. One of them looks like this:
It is also noted that bioimpedance measurements are influenced by a number of factors, so it is important to correctly indicate height/weight/gender and, if allowed, other features, such as skin color.
In Russia, the MEDASS bioimpedance meter is known, which we discussed in the previous material. It also appears in the publication “Encyclopedia of Testing”, where in general the idea of 3-6% error is taken as a basis.
Another way is analysis in the Bod Pod plethysmographic analyzer. It is considered accurate, but I couldn’t find where to make it in Moscow.
